Quick Answer
The seven types of architectural diagrams students use most are concept, circulation, programme (bubble), massing, structural, environmental and exploded axonometric. Each answers one question about the design: the idea, the movement, the arrangement of uses, the form, the load path, the climate response or the assembly. Pick the type by the question a page has to answer.
Most students learn the types of architectural diagrams by copying them. You see a red arrow on a precedent board, a cluster of coloured circles in a senior’s portfolio, a stack of floating floor plates on a competition entry, and you reproduce the look. The result is a page of diagrams that resemble diagrams but explain nothing, because the student never decided what each one was supposed to prove.
A diagram is a drawing with most of the information removed on purpose. What you leave out matters as much as what you keep. This guide takes the seven diagram types that appear most often in studio reviews and portfolios, explains the single question each one answers, and points to a built project where the diagram does real work.
What Makes a Diagram Different From a Drawing?
A drawing records a building; a diagram argues about it. A plan at 1:100 shows every wall, door and window because someone might need to measure them. A diagram of the same plan might show only three coloured zones and one arrow, because the point is that public space sits at the front and private space at the back. If a reviewer needs the scale bar to understand your diagram, it is a drawing.
That distinction gives you a test. Before you draw anything, write the claim in one sentence: “Visitors reach the gallery only after passing the workshop”, or “The roof overhang blocks the high summer sun but admits the low winter sun.” If you cannot write the sentence, the diagram is not ready. If you can, the sentence tells you what to keep and what to delete.
In the evaluation categories Portfolio Mentor uses for reviews, Diagramming sits as its own category, separate from Technical Drawing and Rendering, for this reason: reviewers read diagrams for reasoning, not for drafting skill.
The 7 Types of Architectural Diagrams
The seven types below cover most of what a studio will ask for between first year and thesis. They are ordered roughly by the stage of the design process where each becomes useful, from the first idea to the final assembly.
1. Concept Diagram
The concept diagram states the organising idea of the project in the fewest possible marks. It usually comes first on a project spread, and it should survive being shrunk to a thumbnail. Many strong concept diagrams are a single operation: a box split in two, a line pulled through a block, a grid laid over a site.
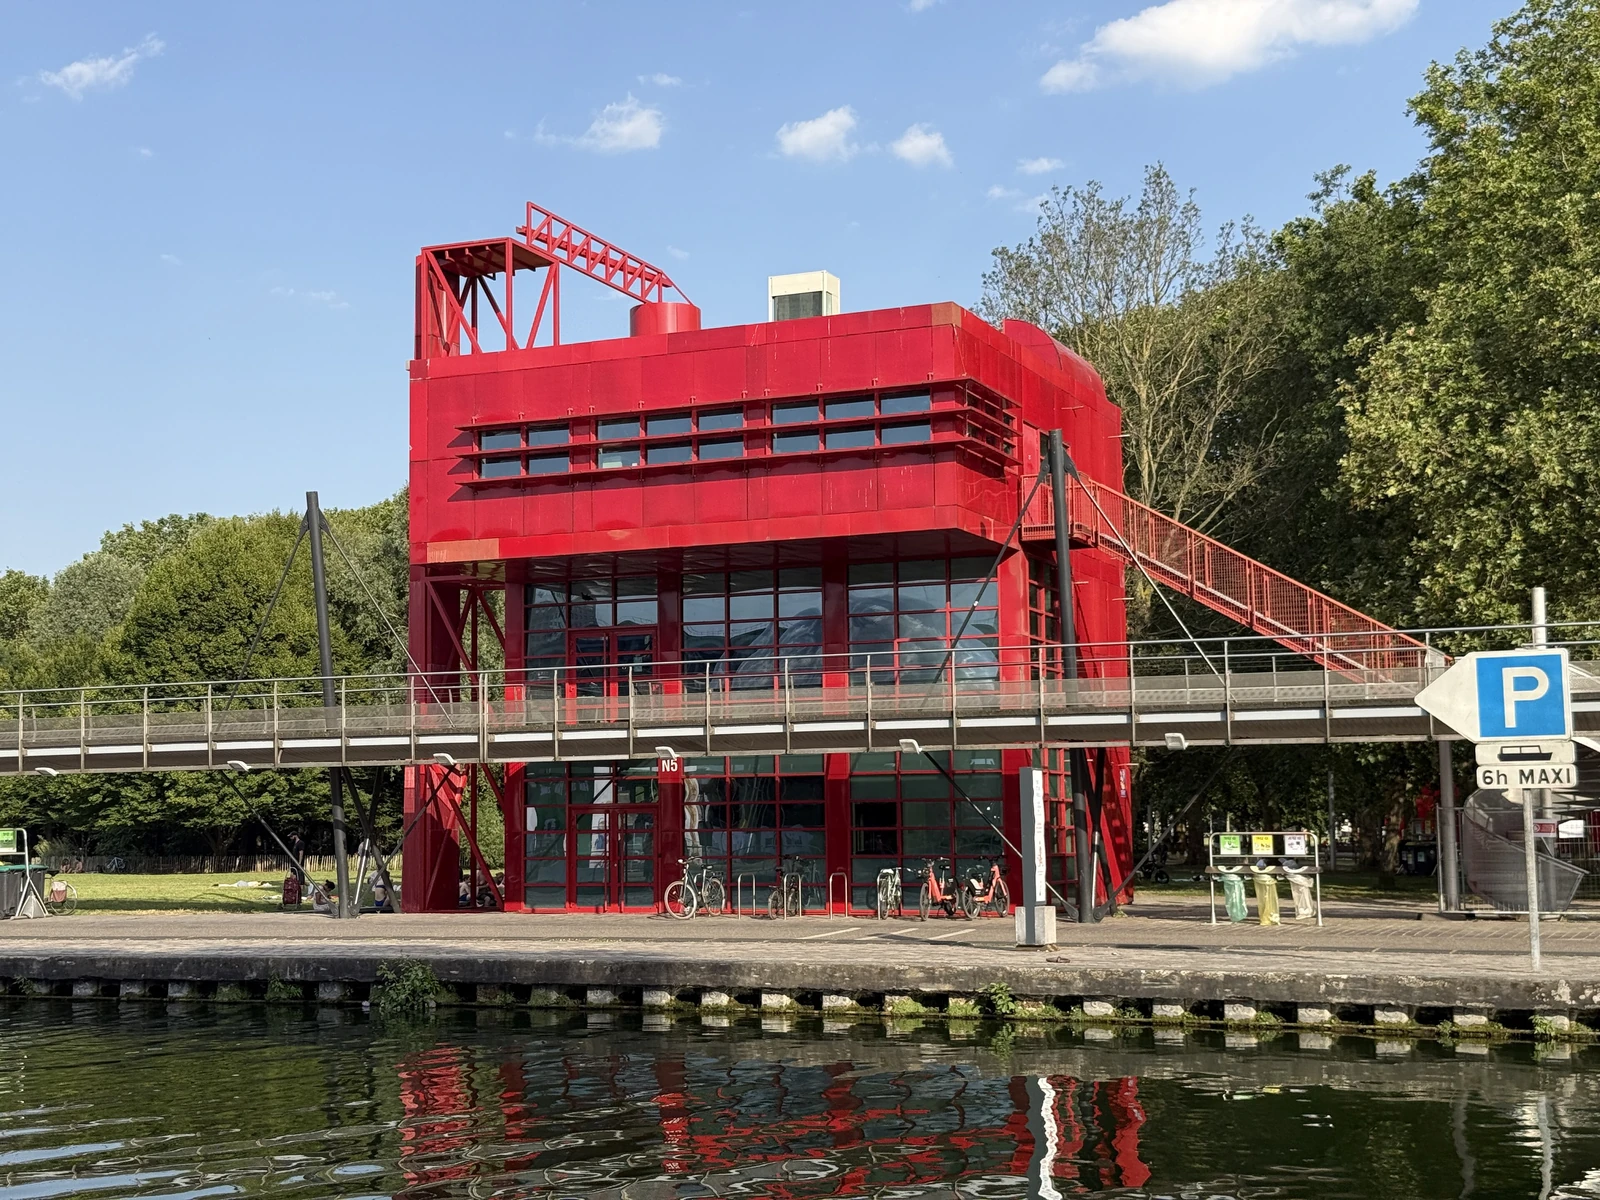
Bernard Tschumi’s Parc de la Villette in Paris, built between 1982 and 1998 on a 125-acre site, is the textbook case. The firm describes a system of dispersed points, the red steel folies, superimposed on a system of lines that organises movement through the park. You can draw that idea with a dot grid and a few lines on tracing paper, and anyone can understand the scheme before seeing a single plan.
For a student project, the concept diagram fails when it illustrates a mood instead of a decision. “Flow”, “connection” and “light” are words, not diagrams. Draw the specific move the building makes because of that word.
2. Circulation Diagram
A circulation diagram shows how people (and sometimes vehicles, goods or services) move through the building: where they enter, which route they take, where routes split, and where they end. It is the diagram reviewers ask for most often in crits, because circulation problems are the easiest to hide in plans and the easiest to expose in a diagram.
The Villa Savoye by Le Corbusier shows why. The curve of its ground floor follows the turning circle of a car that drops passengers at the door and continues to the garage. Inside, a ramp visible from most of the house rises from the entrance hall to the first-floor living spaces and continues outside to the roof solarium. One continuous line drawn through a section of the house explains the whole design.
Draw your circulation diagram on a simplified plan or section, use line thickness to show the main route against secondary ones, and separate public and service routes by colour.
💡 Pro Tip
Draw the circulation diagram in section as well as plan whenever your building has more than one level. Most circulation problems in student schemes are vertical: a lift lands in the wrong place, or a stair forces visitors through a private zone. A plan diagram cannot show either.
3. Programme Diagram (Bubble Diagram)
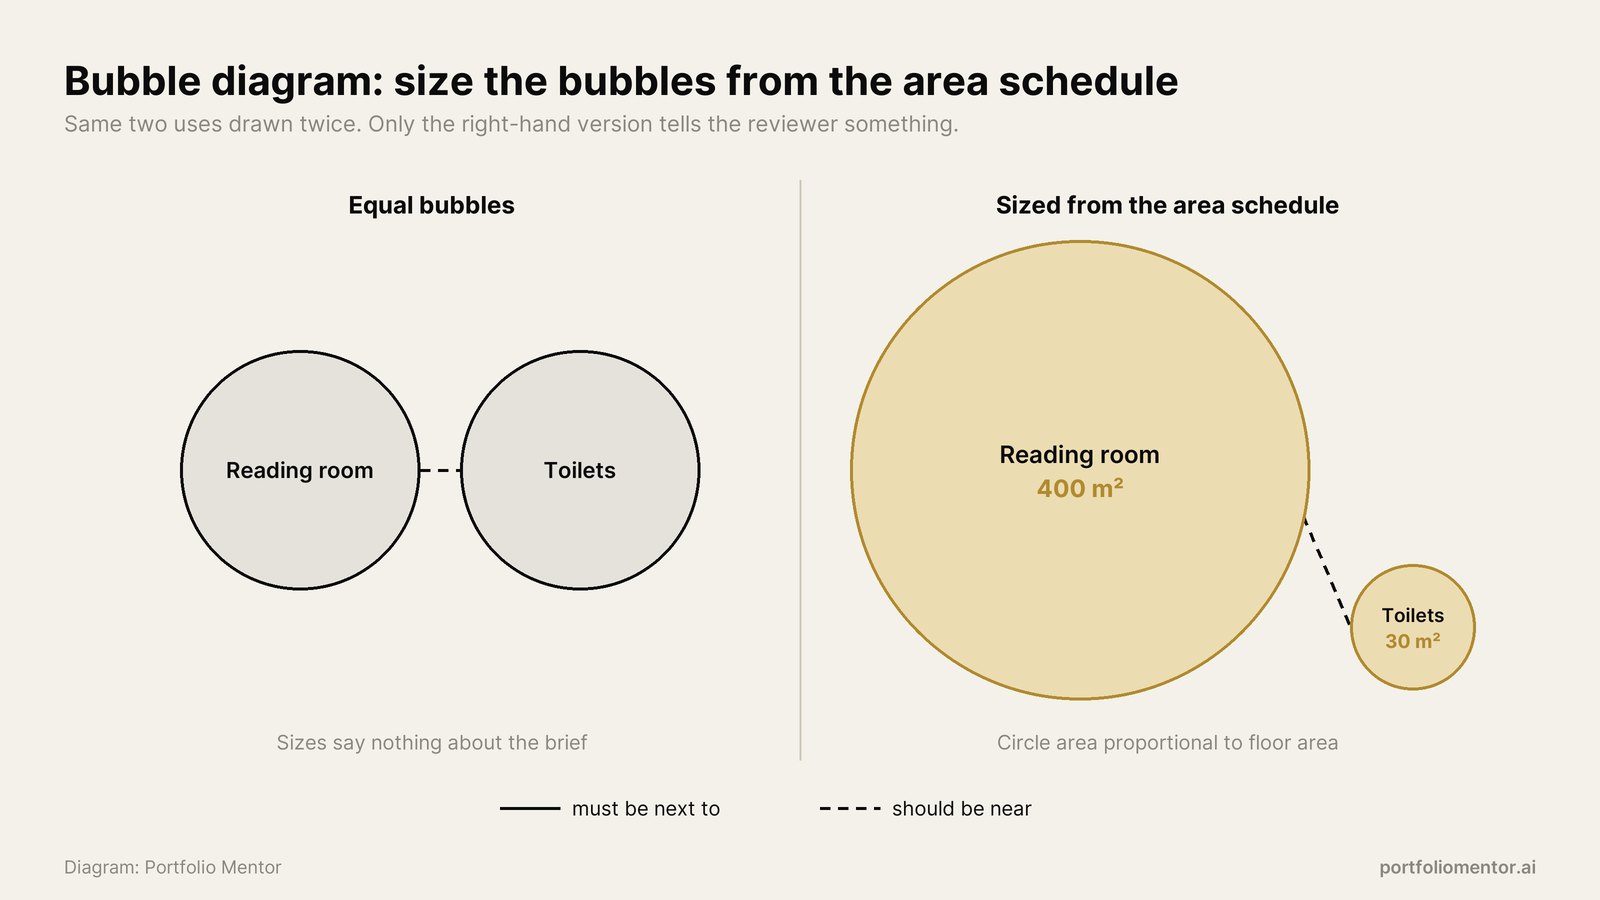
The programme diagram, often called a bubble diagram in its early form, shows the uses in the building, their relative sizes and how they relate. Early on it is loose: circles sized roughly to area, connected by lines for “must be next to” and dashed lines for “should be near”. Later it becomes a stacked or zoned diagram that maps each use onto the actual floors.
OMA’s Seattle Central Library (1999 to 2004) turned that later stage into the building itself. The practice describes the programme as arranged across five platforms and four “in between” planes, and that arrangement dictated the faceted outer shape. The famous section diagram, a column of coloured bands, is a programme diagram first and a form study second.
Students go wrong here by drawing bubbles of equal size. If the reading room is 400 square metres and the toilets are 30, the circles should say so. Size the bubbles from your area schedule, even roughly, and the diagram starts doing analysis instead of decoration.
4. Massing Diagram
A massing diagram shows the building’s overall volume and how it was shaped. The most common format in student work is the step sequence: four to six small axonometrics that start with the maximum buildable volume and apply one operation at a time, such as cutting a courtyard, lifting a corner for a view, stepping down toward a neighbour, or rotating to catch the sun.
The sequence is only convincing if each step has a stated reason under it. “Step 3: pushed back 6 m to keep the street trees” is a diagram. “Step 3: push” is an animation. Keep every frame at the same scale, the same viewing angle and the same line weight so the eye reads only the change.
Massing diagrams overlap with the concept diagram. Use both only if the concept is about something other than form, such as programme or movement. If your concept is a form operation, the massing sequence is your concept diagram, and drawing both repeats the same information.
5. Structural Diagram
A structural diagram shows how loads reach the ground: the primary grid, columns or walls, transfer elements and lateral bracing. In first and second year it is usually a stripped axonometric with the structure drawn in a single strong colour and everything else ghosted. It tells a reviewer that you know what holds the building up, which is a question every jury will eventually ask.
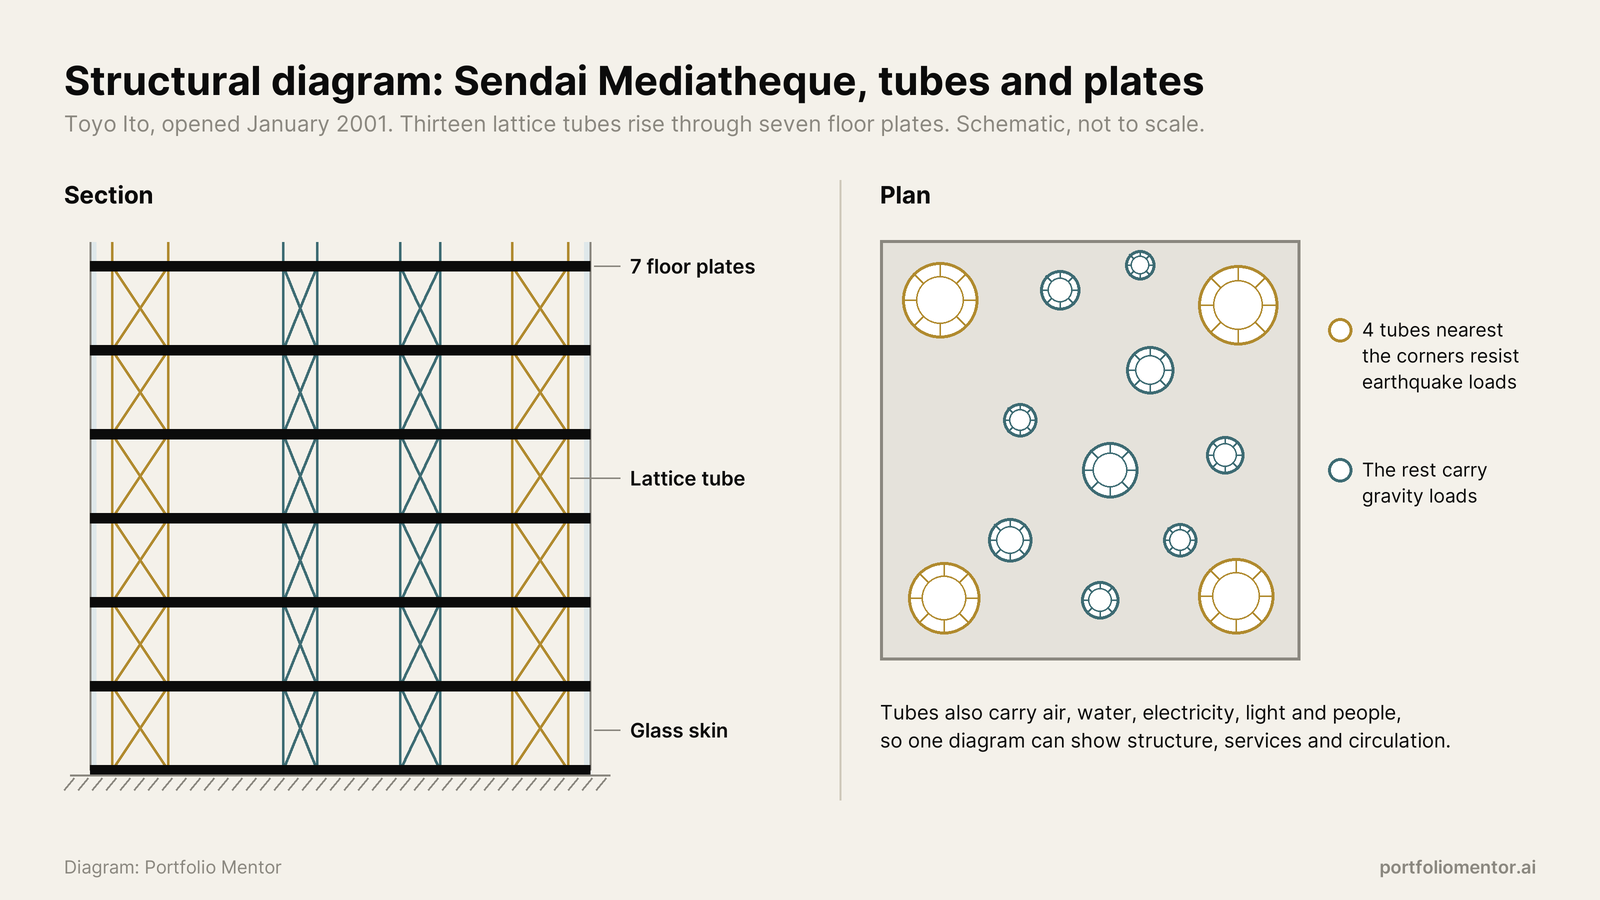
Toyo Ito’s Sendai Mediatheque, which opened in January 2001, is the clearest teaching example. The building has three elements, tubes, plates and skin. Thirteen irregular lattice tubes rise through seven floor plates; the four tubes nearest the corners resist earthquake loads while the rest carry gravity loads. The same tubes also carry air, water, electricity, light and people. One diagram can show structure, services and circulation because the building combines them.
📌 Did You Know?
The Sendai Mediatheque’s floor plates are a honeycomb of steel sections infilled with lightweight concrete, which lets them span between irregularly spaced tubes without beams. The building came through the March 2011 earthquake with little or no damage, a real test of the structural idea its diagrams describe.
6. Environmental Diagram
An environmental diagram shows how the design responds to climate: sun angles, shading, daylight, prevailing wind, cross ventilation, rainwater or thermal mass. It sits closest to the site analysis, and the two are often confused. Site analysis records what the site imposes; the environmental diagram shows what the building does about it.
The most useful format for students is a section with the summer and winter sun angles drawn at the actual angles for the site’s latitude, plus arrows for air movement. Get the angles from a tool rather than guessing. Andrew Marsh’s free 3D Sun-Path web app runs in a browser, has quick presets for the solstices and equinoxes, and can load an OBJ, STL or PLY model to cast shadows on your massing.
Our guide to site analysis in architecture covers where the climate data comes from. The environmental diagram is where that data turns into a decision: an overhang depth, a window position, a courtyard proportion.
7. Exploded Axonometric
The exploded axonometric pulls a building or a detail apart along one axis so each layer is visible: foundations, structure, floors, envelope, roof, sometimes furniture. It shows assembly and hierarchy in one measurable image, which is why it appears in nearly every portfolio. It is also the diagram most often drawn for its looks rather than its content.
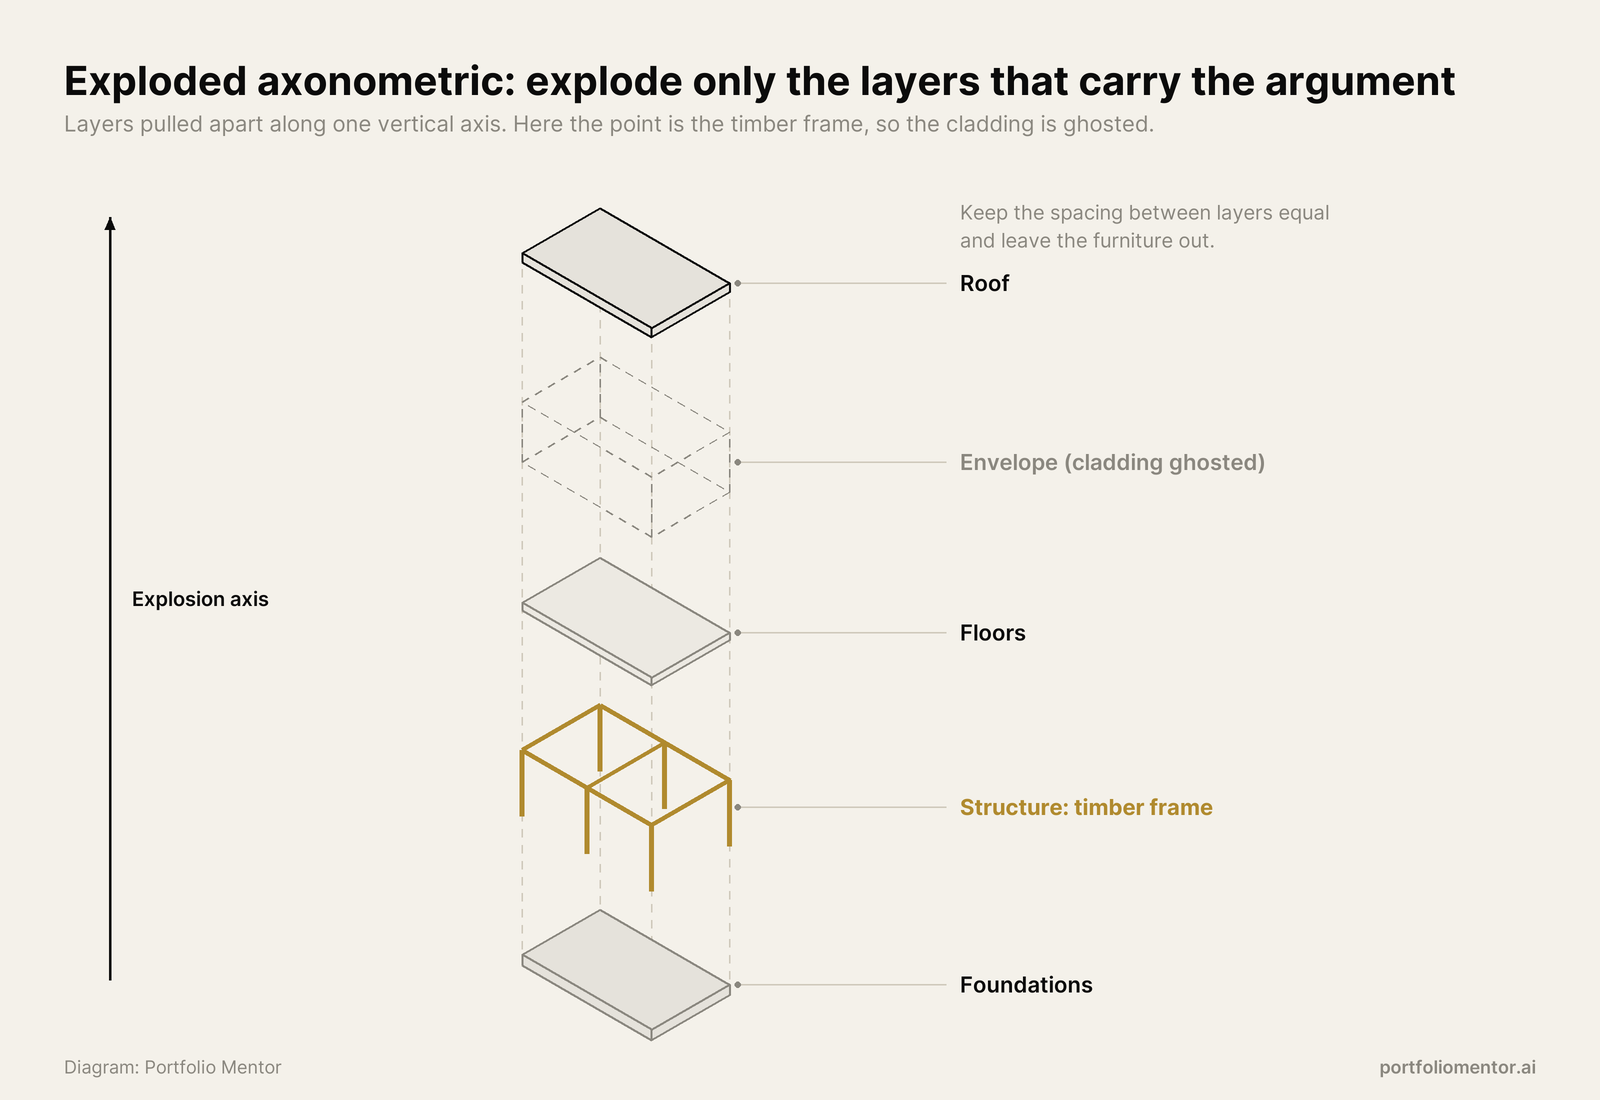
The key decisions are the explosion axis, the spacing between layers and the line weights. Our separate piece on exploded axonometric drawings covers projection, spacing and line weight in detail. For this guide the rule is simple: explode only the layers that carry your argument. If the point is the timber frame, ghost the cladding and leave the furniture out.
Types of Architectural Diagrams Compared
The table sets the seven types side by side by the question each answers, the base drawing it usually sits on, and the stage where it earns its place.
| Diagram | Question it answers | Usual base | Most useful stage |
|---|---|---|---|
| Concept | What is the one idea? | Abstract sketch or plan | First weeks, portfolio opener |
| Circulation | How do people move? | Simplified plan or section | Interim crit onward |
| Programme (bubble) | Which uses go where? | Area schedule, then stacked section | Brief analysis, early design |
| Massing | How was the form shaped? | Step sequence of axonometrics | Early to mid design |
| Structural | How do loads reach the ground? | Stripped axonometric | Mid design to final review |
| Environmental | How does it respond to climate? | Section with sun and air | Mid design to final review |
| Exploded axonometric | How is it put together? | 3D model, separated layers | Final review, portfolio |
How to Choose Which Diagrams a Project Needs
No project needs all seven. A small pavilion might need a concept diagram, a structural diagram and an exploded axonometric. A library or school almost always needs a programme diagram and a circulation diagram, because those are the problems the building has to solve. A housing project on a tight urban site will lean on massing and environmental diagrams.
A practical way to decide is to list the three questions a jury is most likely to ask about your scheme, then make sure one diagram answers each. If a reviewer asked “how do you get to the roof terrace?” at your last crit, that is your circulation diagram. If they asked “why is it this shape?”, that is your massing sequence. Diagrams drawn to answer real questions are always more specific than diagrams drawn to fill a board.
⚠️ Common Mistake to Avoid
Putting a generic sun path and wind rose on every project page. If the building would look the same with the sun coming from the other side, the diagram proves nothing. Show the overhang, the window or the courtyard the sun data changed, or leave the diagram out.
Making Diagrams on a Student Budget and a Studio Deadline
You do not need paid software to diagram well. Tracing paper over a printed plan, a fine black pen and one coloured marker will produce a concept, circulation or programme diagram in a single sitting, and hand-drawn diagrams often read more clearly than digital ones because the hand forces you to simplify.

For digital work, keep one base file per project. Export a clean plan, a section and a single axonometric view from your model at the same scale, then build every diagram as a layer over those bases. Switching between massing, structural and exploded views becomes a matter of turning layers on and off, which saves hours in the last week before a review.
Consistent Graphic Rules Across the Set
Pick one colour for each idea and keep it across every diagram in the project. If circulation is orange on the plan, it is orange on the section and on the exploded axonometric. Use one line weight for the base drawing (thin, grey), one for the element being explained (thick, black or colour), and nothing in between. Label in the same typeface and size as the rest of your board. Our portfolio layout guide covers grids and type sizes that keep diagram pages consistent with the rest of the book.
Diagrams can also sit alongside collage and image work on the same spread. If you use collage to set the mood of a project, our piece on architecture collage explains how to keep the image and the diagram doing different jobs.
How Diagrams Read in a Portfolio
In a portfolio, diagrams do the explaining that a reviewer has no time to do. Someone flicking through a whole portfolio will look at your hero image, then at the smallest drawing that explains it. That drawing is usually a diagram. A project with three clear diagrams (concept, one of circulation or programme, one of structure or assembly) reads as finished thinking even when the renders are modest.
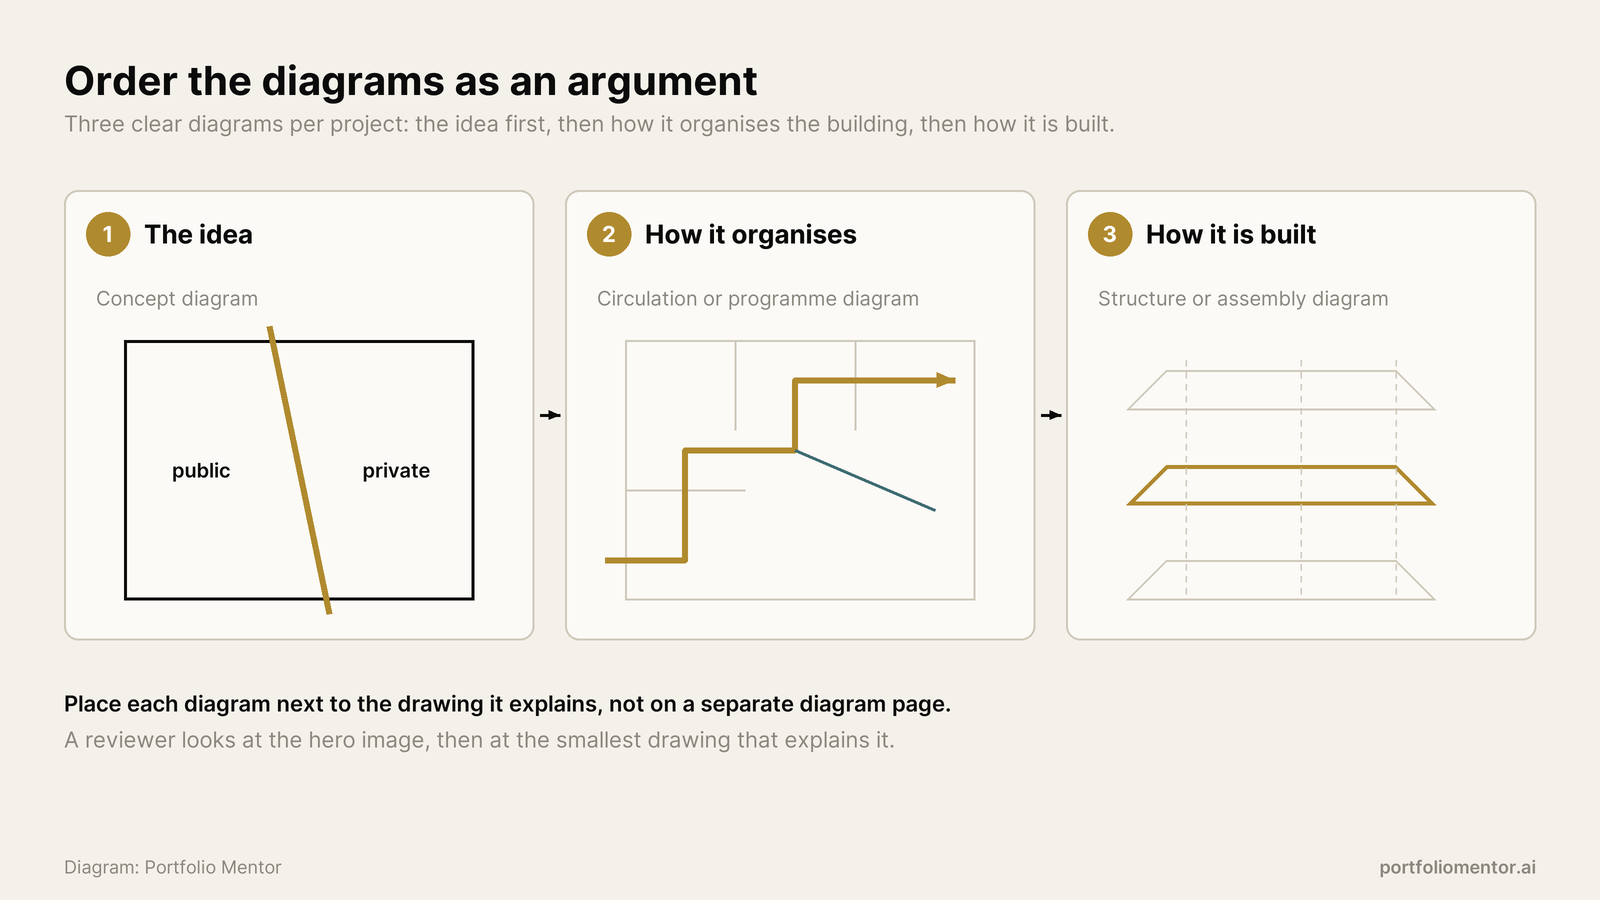
Order them as an argument: the idea first, then how it organises the building, then how it is built. Place each diagram next to the drawing it explains rather than collecting all diagrams on one page. If you are assembling a first book, our guide to the undergraduate architecture portfolio shows how diagram pages fit into a short application document. For a list of what tends to cost students interviews, including diagrams with no stated purpose, see our architecture portfolio mistakes breakdown.
Putting It All Together
Quick Recap:
- Each of the seven types of architectural diagrams answers one question, so write that question before you draw.
- Pick two to four diagram types per project based on the questions a jury will actually ask.
- Use built precedents such as La Villette, the Villa Savoye, the Seattle Central Library and the Sendai Mediatheque to see each type doing real work.
- Keep one colour per idea and one base drawing per view so the whole diagram set reads as a single argument.