Site analysis in architecture is the study of everything a site imposes on a design before the design exists: topography, climate, access, boundaries, regulation and context. In a portfolio it is the page that proves your scheme responded to something real rather than arriving fully formed.
It is also the page most often faked. A sun path arrow, a wind rose copied from a template and three arrows labelled “views” appear in thousands of student portfolios, and reviewers have learned to skip them. The diagram is not the problem; the absence of any consequence is.
This guide covers what to gather, where the data actually comes from, how to draw it so it carries weight, and the test that separates real analysis from decoration.
What does site analysis in architecture include?
Six categories cover almost every project. You will not need all of them, and choosing which to pursue is itself part of the analysis.
Physical
Topography, contours, drainage, soil, existing vegetation and existing structures. This is the layer that determines what is buildable and at what cost, and it is the one students most often skip because it is the least visual.
Climatic
Sun path, prevailing wind, temperature range, rainfall and humidity. Real measured values are freely available, and using them instead of generic diagrams is the single fastest way to make an analysis page credible.
Access and movement
Vehicle approach, pedestrian routes, public transport, service access, and where people actually arrive from rather than where the road is.
Legal and regulatory
Zoning, setbacks, height limits, rights of light, easements, conservation designations and flood status. This layer changes what is possible more than any other and is almost absent from student work.
Sensory and experiential
Noise, views in and out, privacy, smell, materials of adjacent buildings. This is where drawing is better than data.
Social and historic
How the site has been used, who uses the area, what the building next door is for. The layer that most often produces a project’s actual argument.
🔢 Quick Numbers
- Solar irradiance, temperature, humidity and wind data by coordinate, free and citable: NASA POWER
- Thirty-year temperature and precipitation baselines for US stations: NOAA US Climate Normals
- Topography, hydrography, boundaries and elevation data for US sites: USGS National Map
Naming the source on the drawing costs one line of text and changes how the page is read. “Prevailing wind from the southwest” is an assertion. “Prevailing wind from the southwest, NOAA station data” is evidence.
⚠️ Common Mistake to Avoid
Drawing a sun path diagram that would be identical anywhere at that latitude, then not using it. A sun study earns its page only when a decision follows: a rotated plan, a shifted opening, a shading device sized to a specific angle. If the building would be the same without the diagram, the diagram is filler and a reviewer will read it that way.
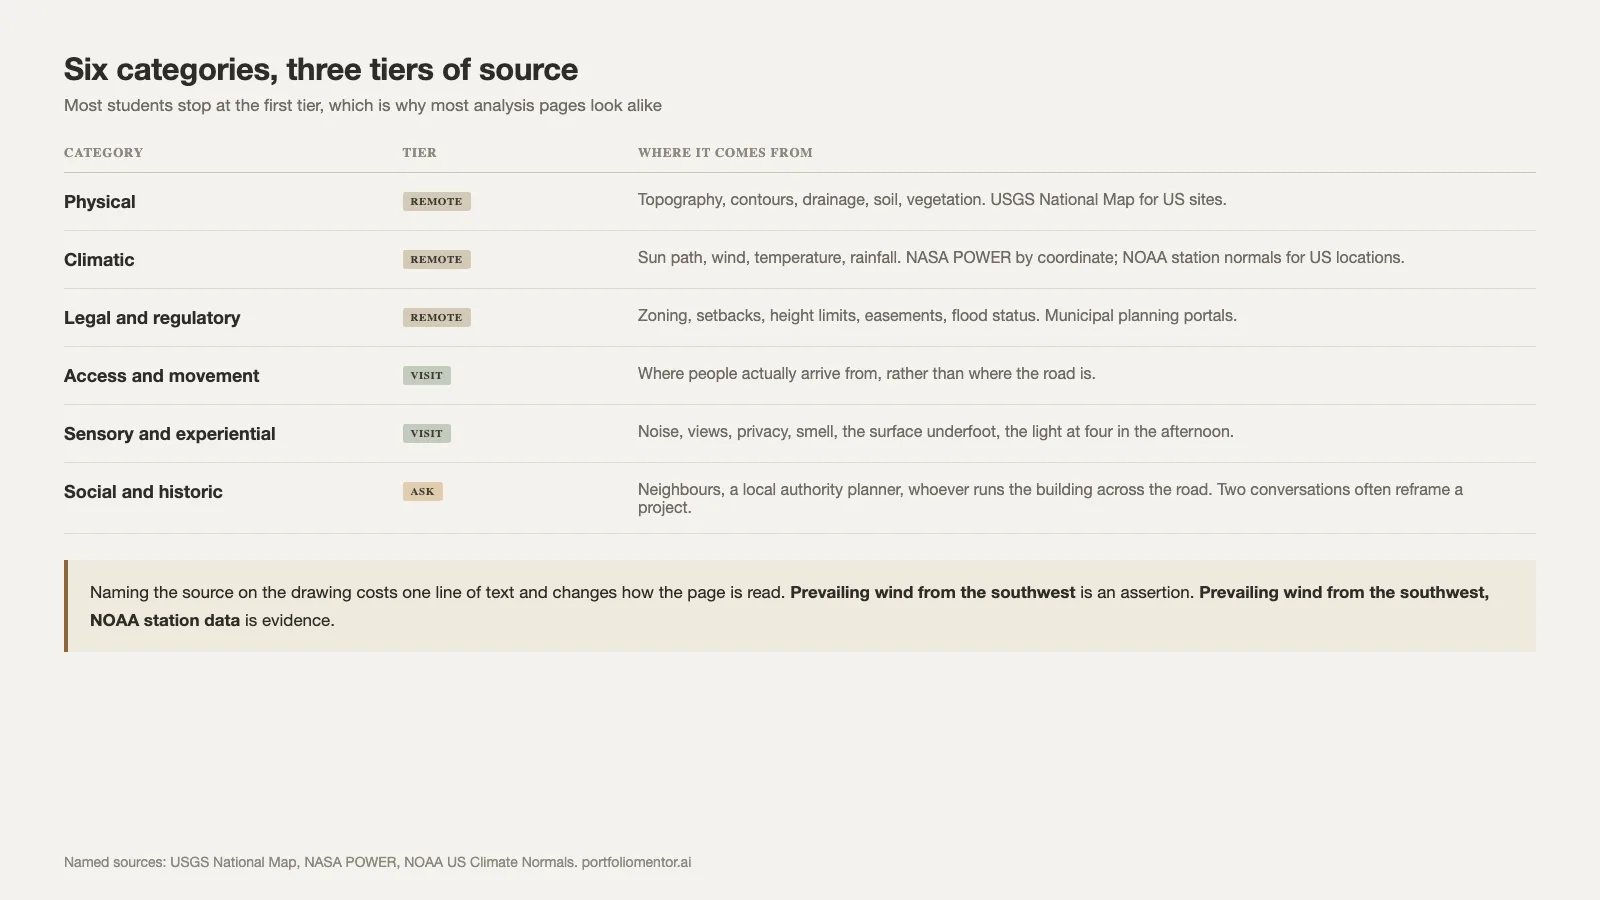
Where the data comes from
Site analysis in architecture draws on three tiers of source, and most students stop at the first.
Remote sources give you coordinates, contours, climate baselines and aerial imagery. NASA POWER returns solar and meteorological values for any coordinate, NOAA publishes long-term station normals for US locations, and USGS provides elevation and hydrography. Municipal planning portals publish zoning and constraint layers.
Visiting gives you everything the data cannot: sound, smell, the surface underfoot, where people cut across, what the light does at four in the afternoon. Photograph it with the same discipline you would use for model photography. A single visit with a camera and a notebook produces more usable analysis than a week of downloading.
Asking gives you history and use. Neighbours, a local authority planner, whoever runs the building across the road. Two conversations often reframe a project.
Portfolios that show evidence of the second and third tiers stand out immediately, because almost nobody does them.
How do you draw site analysis that is not decoration?
Four rules produce pages that survive review.
One finding per drawing
A single diagram carrying sun, wind, noise, views and access proves nothing because no reader can extract anything from it. Four small diagrams with one finding each are read; one crowded diagram is skipped. The same density rule governs the page layout they sit on.
State the finding in words
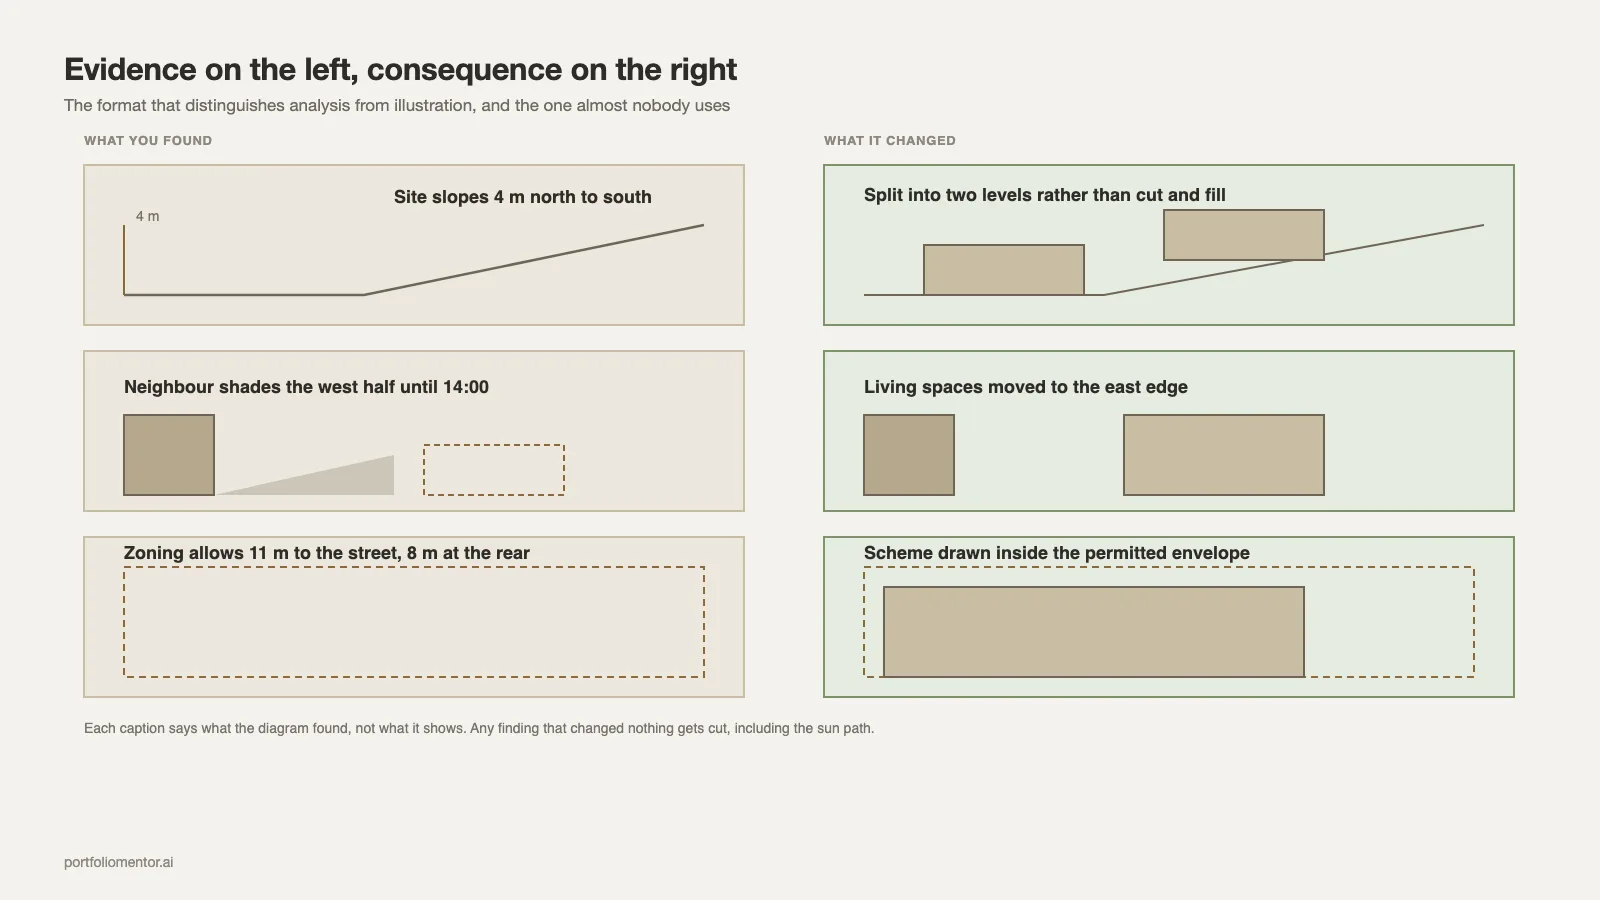
Give each diagram a caption that says what it found, not what it shows. “Site slopes 4 m north to south” rather than “topography”. The caption is what the reviewer reads; the drawing supports it.
Draw the consequence next to the evidence
The strongest site analysis page pairs each finding with the design move it produced. Evidence on the left, consequence on the right. This is the format that distinguishes analysis from illustration, and it is rare enough in student work to be memorable.
Keep one graphic language
Same base drawing, same north point, same scale bar, same colour meaning across every diagram in the set. Analysis pages drawn in four different styles read as four different people.
💡 Pro Tip
Before drawing anything, write the three sentences your analysis concluded. If you cannot write three, you have not analysed the site, you have described it. Students who do this find that two of their planned diagrams disappear and the remaining ones get better, because each one now has a job.
Six diagrams that actually earn their space
Rather than a checklist of everything possible, these are the ones that repeatedly change a scheme.
Shadow study with real context heights
What it shows: which parts of the plot are in shade, at which times, because of specific neighbouring buildings. Requires you to model the surroundings at approximate heights, which takes an hour and produces a genuinely site-specific result rather than a latitude-specific one.
Buildable envelope
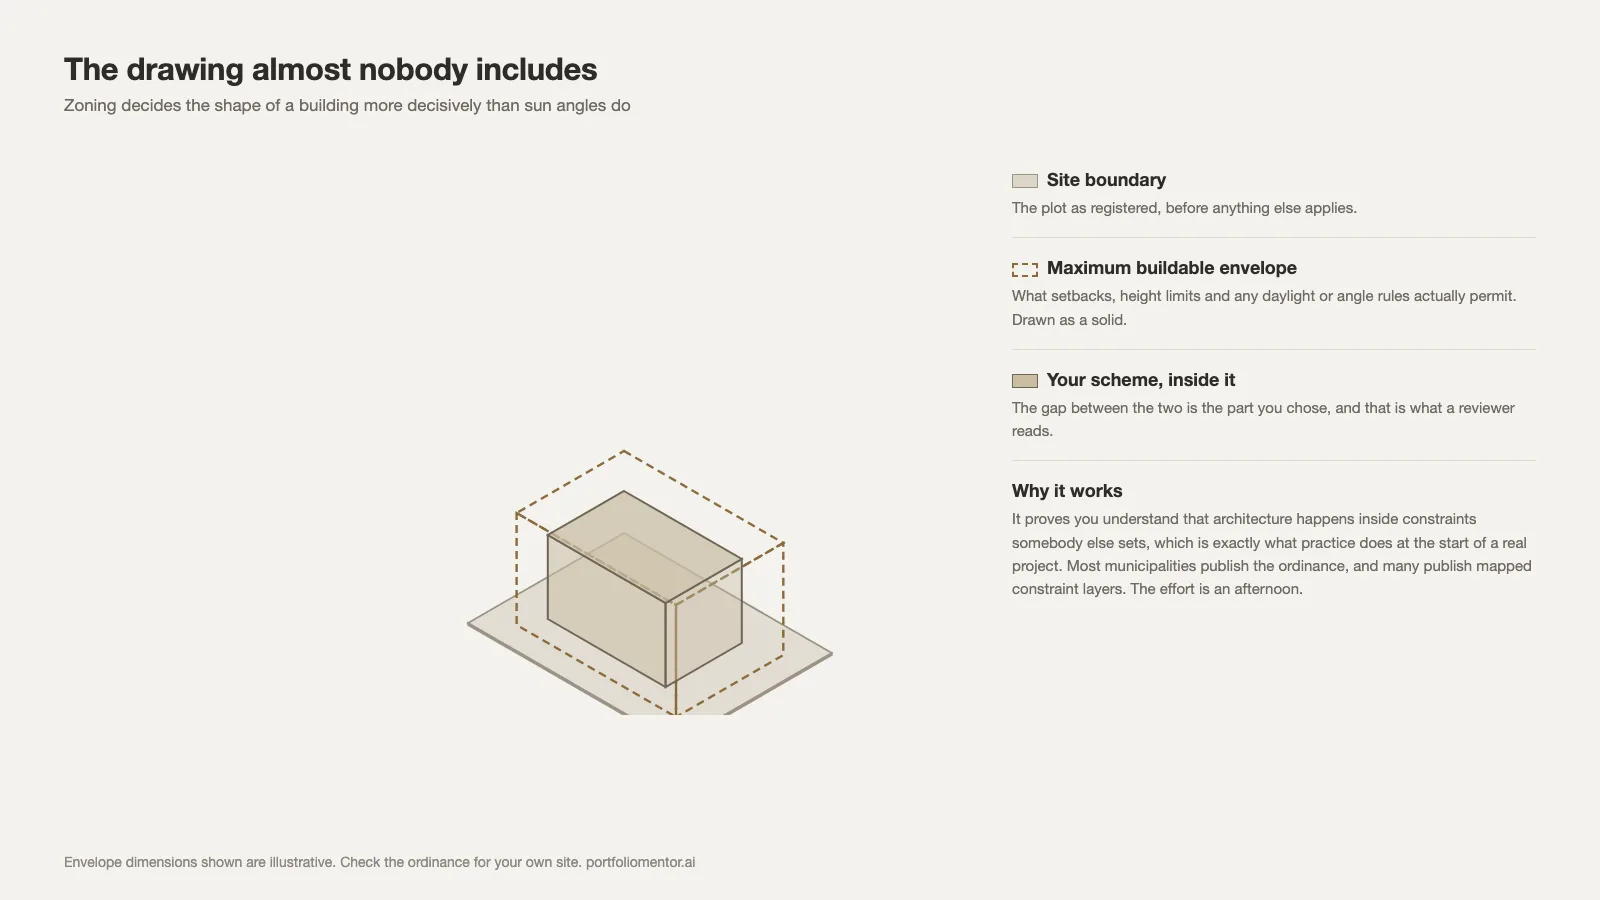
The volume permitted by setbacks, height limits and any daylight or angle rules, drawn as a solid, with your scheme inside it. Immediately legible and almost never included by students.
Approach sequence
A short series of what a person sees walking to the site from where they actually arrive. Photographs or sketches in sequence, not a plan with an arrow. Sequences like this are also what lift an undergraduate portfolio above a set of final images. This is the diagram that most often reframes an entrance decision.
Section through the site and its neighbours
Topography, adjacent building heights and your volume in one cut. It answers scale, privacy and overlooking in a single drawing and replaces three weaker diagrams.
Existing material and condition survey
Photographs of the surfaces, boundaries and structures already present, annotated. On reuse and infill projects this is the most useful page in the set, and on new build it still grounds the material argument.
Use over time
How the site and its surroundings are occupied across a day or a week. Two or three small plans rather than one. This is where social and programmatic arguments come from, and it cannot be produced remotely.
Six is more than any single project needs. Three of these, chosen because they bear on the actual problem, outperform a full set produced out of obligation. The selection judgement behind that is the same one that governs which projects enter a book at all, discussed in published portfolio examples.
Doing this for a site you cannot visit
Competitions, remote studios and application projects sometimes rule out a visit. The analysis can still be honest if you say so.
State on the drawing that the study is desk-based and name what you could not verify. Reviewers respect that far more than a confident claim about noise or surface that clearly came from an aerial photograph. Street-level imagery, municipal records, local news and published photographs fill part of the gap, and a conversation with someone who knows the area fills more of it than any of them.
What cannot be faked is the sensory layer, so a desk-based analysis should lean on the measurable categories and be quiet about the ones it could not access. Overclaiming here is one of the easier things for an experienced reader to catch, and it undermines the pages that were accurate. The same principle applies to describing your role in group work, covered in the undergraduate portfolio guide.
The regulatory layer, which almost nobody shows
Zoning envelopes, setbacks and height limits determine the shape of a building more decisively than sun angles do, and they are close to absent from student portfolios.
Drawing the maximum buildable envelope and then showing your scheme inside it is one of the most convincing single images an application portfolio can contain, because it proves you understand that architecture happens inside constraints somebody else sets. It also happens to be exactly what practice does at the start of a real project.
Most US municipalities publish zoning ordinances and many publish mapped constraint layers. The effort is an afternoon and the differentiation is substantial.
Site analysis in a portfolio versus in a studio
Site analysis in architecture serves two different documents, and treating them as one is why the page usually fails.
In studio, analysis is exploratory and its value is partly in the process. In a portfolio, only the findings that changed the design deserve space. Everything else is evidence of effort, and effort is not a category anyone scores.
One page, occasionally two, is the right allocation in a project of four to six pages. If analysis occupies a third of a project, the reader concludes the building is the weaker part, and they are usually right.
Where the analysis sits matters too. It belongs after the image that establishes what the project is and before the resolved drawings, so the reader knows what they are looking at before they are asked to care why. Sequencing within a project is covered in portfolio layout and design, and the space you have to work with in the architecture portfolio guide.
📐 Technical Note
Solar geometry depends on latitude, date and time, not on the building. A sun path for 40 degrees north is the same in New York and Madrid, which is why a generic diagram carries no information about your site. What is site-specific is obstruction: what shades the plot and when. A shadow study using surrounding building heights says something; a bare sun path does not.
What reviewers are scoring
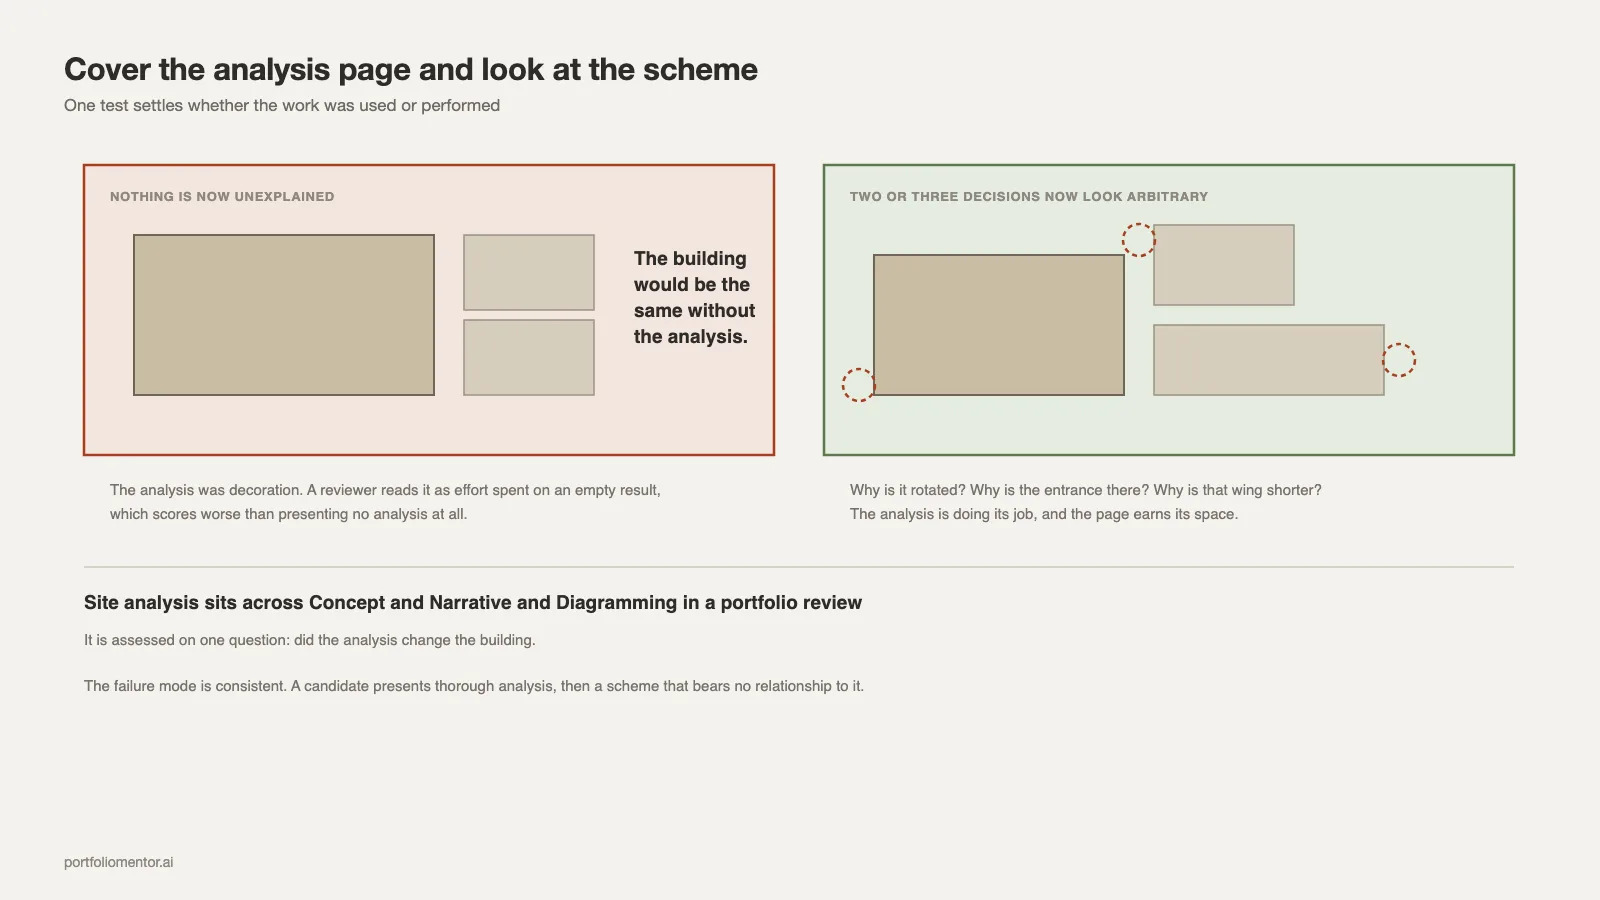
Site analysis sits across Concept & Narrative and Diagramming in a portfolio review, and it is assessed on one question: did the analysis change the building.
The failure mode is consistent. A candidate presents thorough analysis, then a scheme that bears no relationship to it. That reads worse than presenting no analysis at all, because it demonstrates that the work was performed rather than used.
The test is simple enough to run yourself. Cover the analysis page and look at the scheme. If nothing about the building is now unexplained, the analysis was decoration. If two or three decisions suddenly look arbitrary, the analysis is doing its job. Related failure patterns are collected in common architecture portfolio mistakes.
A workable sequence
- Pull remote data first: contours, climate normals, zoning, imagery. Half a day.
- Visit. Photograph systematically, note sound and surface, sketch what the data missed.
- Write the three findings. This is the analysis; everything before it was collection.
- Draw one diagram per finding on a shared base, at one scale, in one language.
- Pair each with the design move it caused, and cut any finding that caused none.
Step five removes about half of what most students planned to include, which is the point. What remains after that cut is also the material that answers interview questions well, since interviewers probe exactly this link between evidence and decision, as the set in architecture interview questions shows.
The short version
Gather from remote data, a site visit and two conversations. Name your sources on the drawing. Write three findings before drawing anything. One finding per diagram, one graphic language, and the design consequence shown beside the evidence. Cut every diagram that did not change the building, including the sun path if it did not.